Property & Casualty
Energy State of the Market | Global Energy and Climate Technology
Energy State of the Market | Global Energy and Climate Technology
Overview
Many insurance professionals are wondering how US energy policy will impact the growth of renewable energy. Many insurance carriers in the energy sector saw profitability in 2024 despite significant CAT events. In 2025, the market continues to deliver a stabilized and softening underwriting environment characterized by flat or decreasing rates, increased CAT sub limits and overall improvement of coverage terms.
In Q1, property pricing and retention decreases became a reality and are expected to continue throughout the year. Casualty insurance lines have had mixed results through 2024, with specific liability lines of coverage and perils presenting new challenges.
This year, carriers are focused on retaining existing business and growing the book as competition steadily increases. There is a capacity influx helping stabilize markets, and aggressive carriers are looking for market share. Both domestic and new London capacity express a desire to either provide lead terms or participate, determined by market capacity. Some new markets include but are not limited to, Allianz, FM Global and Volt & Novagen. With respect to NATCAT, 2025 pricing seems to be unaffected, with carriers deploying higher limits at flat or reduced rates for profitable accounts. Other factors driving rates and terms are overall premium spend and competition on primary layers.
There is a continued flight to quality. Portfolios with diverse CAT risk profiles, especially those with lower risk profiles and favorable loss experience, can oversubscribe both construction and operating property coverage placements. Portfolios with higher levels of high-hazard CAT exposures are rewarded for their pre-construction risk mitigation efforts in areas such as engineering, product selection, project siting, construction and operational protocols. As an outlier, Brown & Brown has renewed a highly unprofitable master program with significant high hazard NAT CAT exposure and essentially flat rates, terms and conditions.
Industry mutual, AEGIS, is deploying significant capacity, leading placements for members and serving as influential follow-markets for non members. They have adapted their products to satisfy renewable energy investor requirements and to support insureds’ risk management needs. Energy Insurance Mutual (EIM) continues with stalwart support for renewable energy space. EIM recently announced its USD 25 Million member distribution payable this year. EIM shared that the surplus was sufficient to continue exploring and expanding the available offerings for wildfire coverage.
Through the first quarter, 2025, the market has softened as increased capacity insurers have renewed treaties:

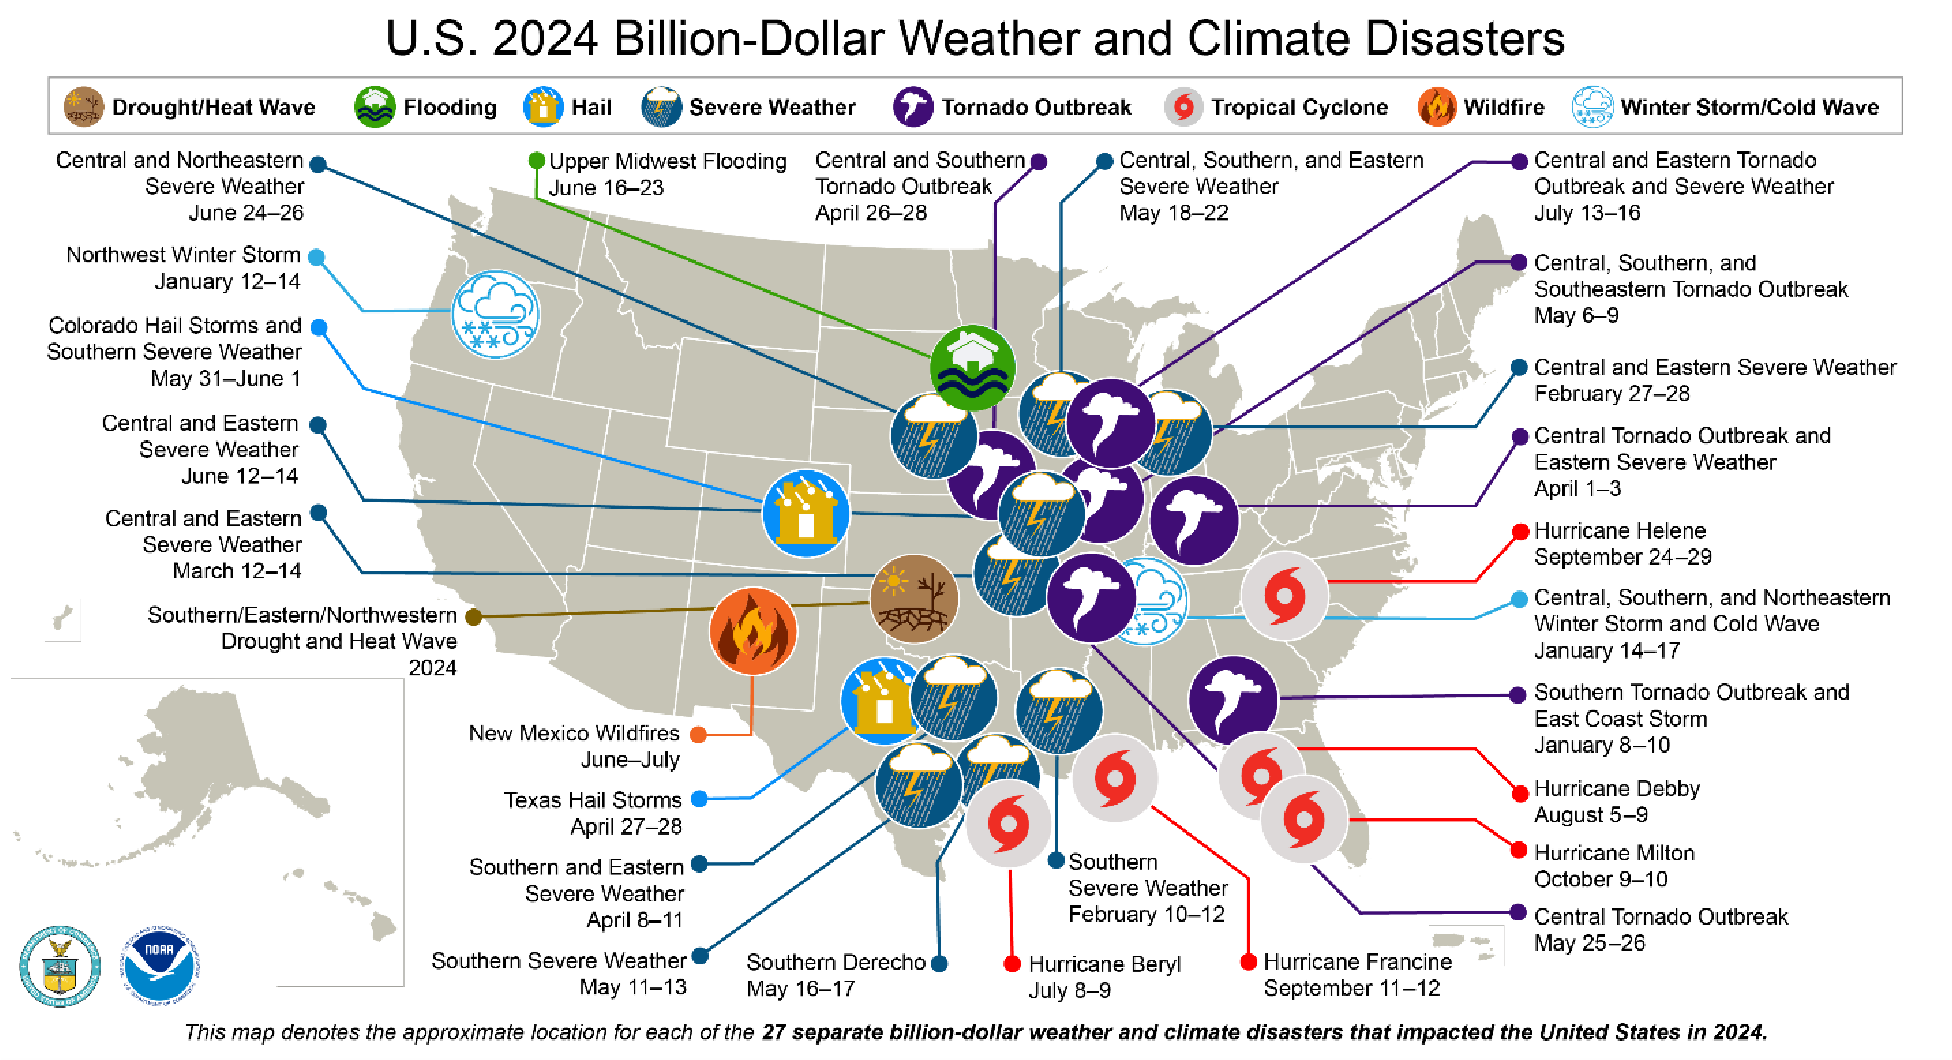
- In 2024, the US experienced 27 weather events with losses greater than $1B. 1
- More than 80% of these events are attributed to severe storms and tropical cyclones 1
- Compared to 2023, there were 28 weather events greater than $1B, 75% related to severe storms and tropical cyclones 1
- The 1980–2024 annual average was 9.0 events; the annual average for 2020–2024 was 23.0 events. 1
Billion-Dollar Climate Disasters
Climate disasters are growing in frequency and severity, with severe convective storms (SCS) being the most significant cause of expensive catastrophes. In response, insurance markets are increasing self insured retentions/deductibles for SCS-related perils and often placing lower limits on SCS, which are subject to annual aggregate limits. Historically, these types of measures were mainly in place for Tier 1 and 2 (coastal exposed), Named Windstorm and High-Hazard Earthquake.
With the frequency of weather catastrophe perils and aggregate limits, insureds should consider evaluating risks of exposure, loan requirements and other factors to determine if it’s necessary to pre-purchase reinstatement limits at the time of renewal/program placement. After an area-wide event, the cost to reinstate can be considerably higher, and there could be a delay in the reinstatement, leaving projects without sufficient cover for a second near-term event.
Solar & Wind
The graphs below show Brown & Brown customer losses in the Solar and Wind space over the last seven years by type and number of occurrences. Over the last seven years, SIRs have increased while the frequency and attritional losses for property damage have declined. However, there is often a business interruption recovery, as typical BI waiting periods are 30 to 45 days.
Note that the BI limit for renewable projects is usually 12 months and can include a monthly limit. Given supply chain and access constraints for renewable projects, the BI period is often longer than the 30-45 day waiting period.
Brown & Brown Customers: Solar Loses 2018-2024
As of year end 2024
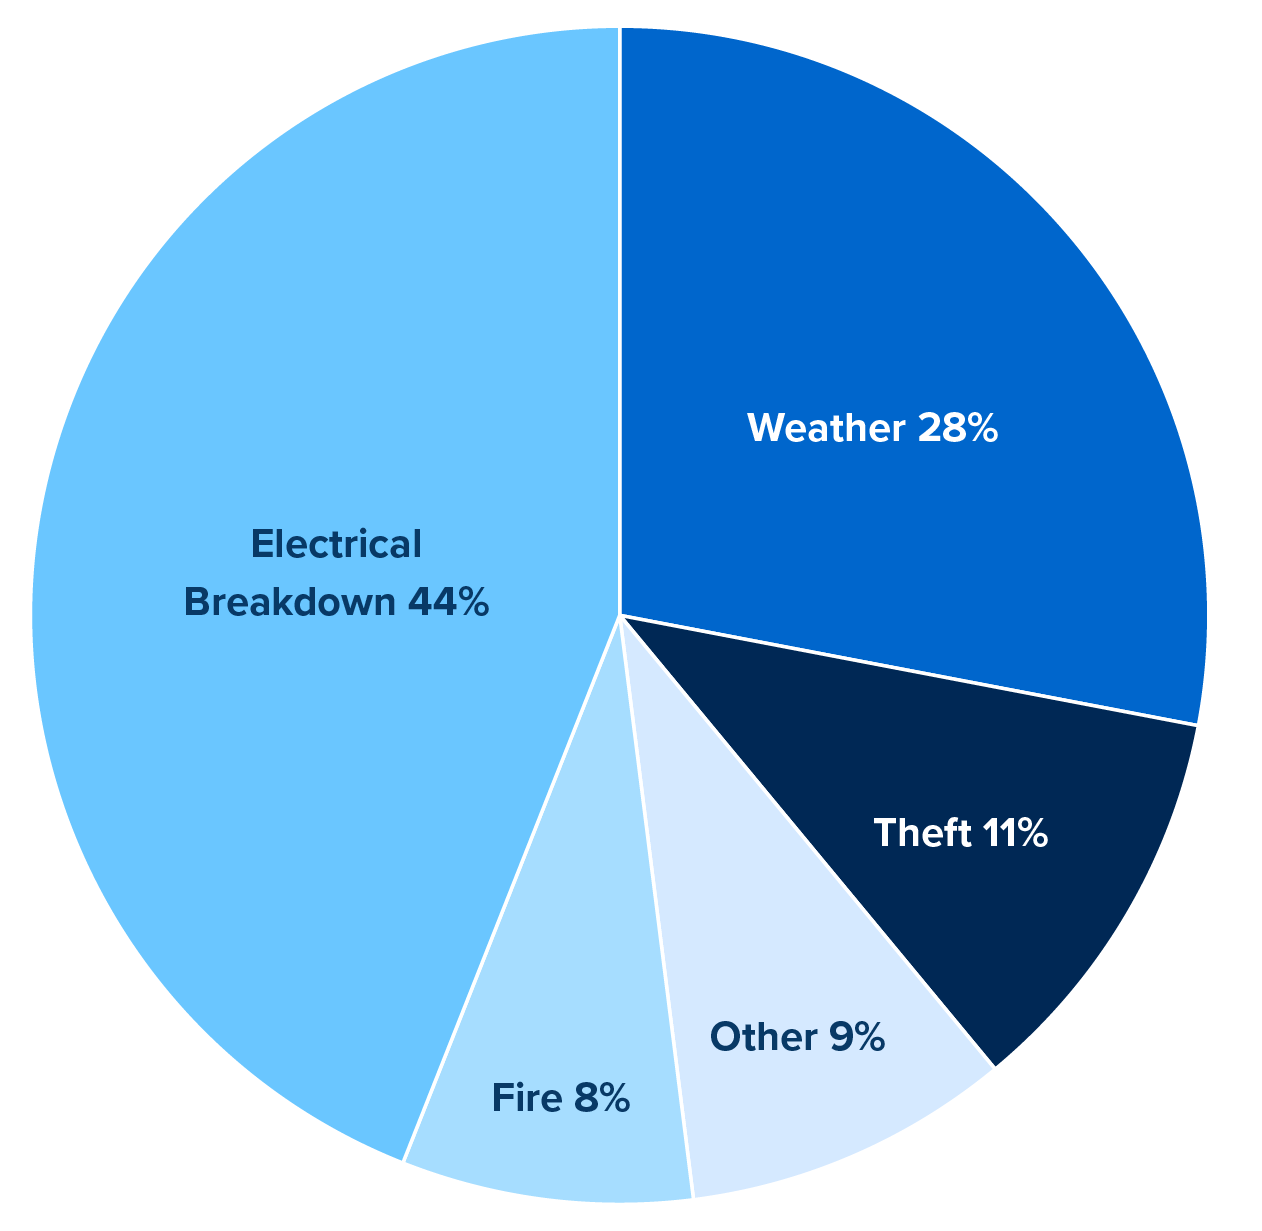
The graph above depicts the number of occurrences. The severity of Solar losses is often tied to weather events. However, the breakdown of a main power transformer can also produce significant losses. When there is a severe loss, the BI restoration period typically exceeds the 12 month limit.
Solar Power & Hail Stowage Protocols
Hail continues to present the greatest underwriting challenges in the solar industry. Carriers and project investors continue to struggle with currently available desktop modeling platforms.
In February and March of 2024, the Texas solar industry encountered a tipping-point moment with the Fort Bend County, Texas, hailstorm outbreak. Damages from the Fort Bend County event surpassed available coverage for the Fighting Jays project, while other nearby projects incurred minimal damages. The independent engineering firm VDE-America released its postmortem report, Technical Memorandum; Effectiveness of Hail Stow Protocols in Mitigating Damage to Solar Projects, documenting the divergent damage results associated with proper and improper defensive stowage.
Underwriters are expected to focus on such defensive hail stowage protocols when underwriting high-hazard hail. Some form of standardized hail-stowage testing and result record-keeping is anticipated to be developed by year-end. These testing protocols and carrier utilization of defensive stowage testing results will continue to evolve as more projects encounter hailstorms with large-diameter hail stones.
Brown & Brown Customers: Solar Loses 2018-2024
As of year end 2024
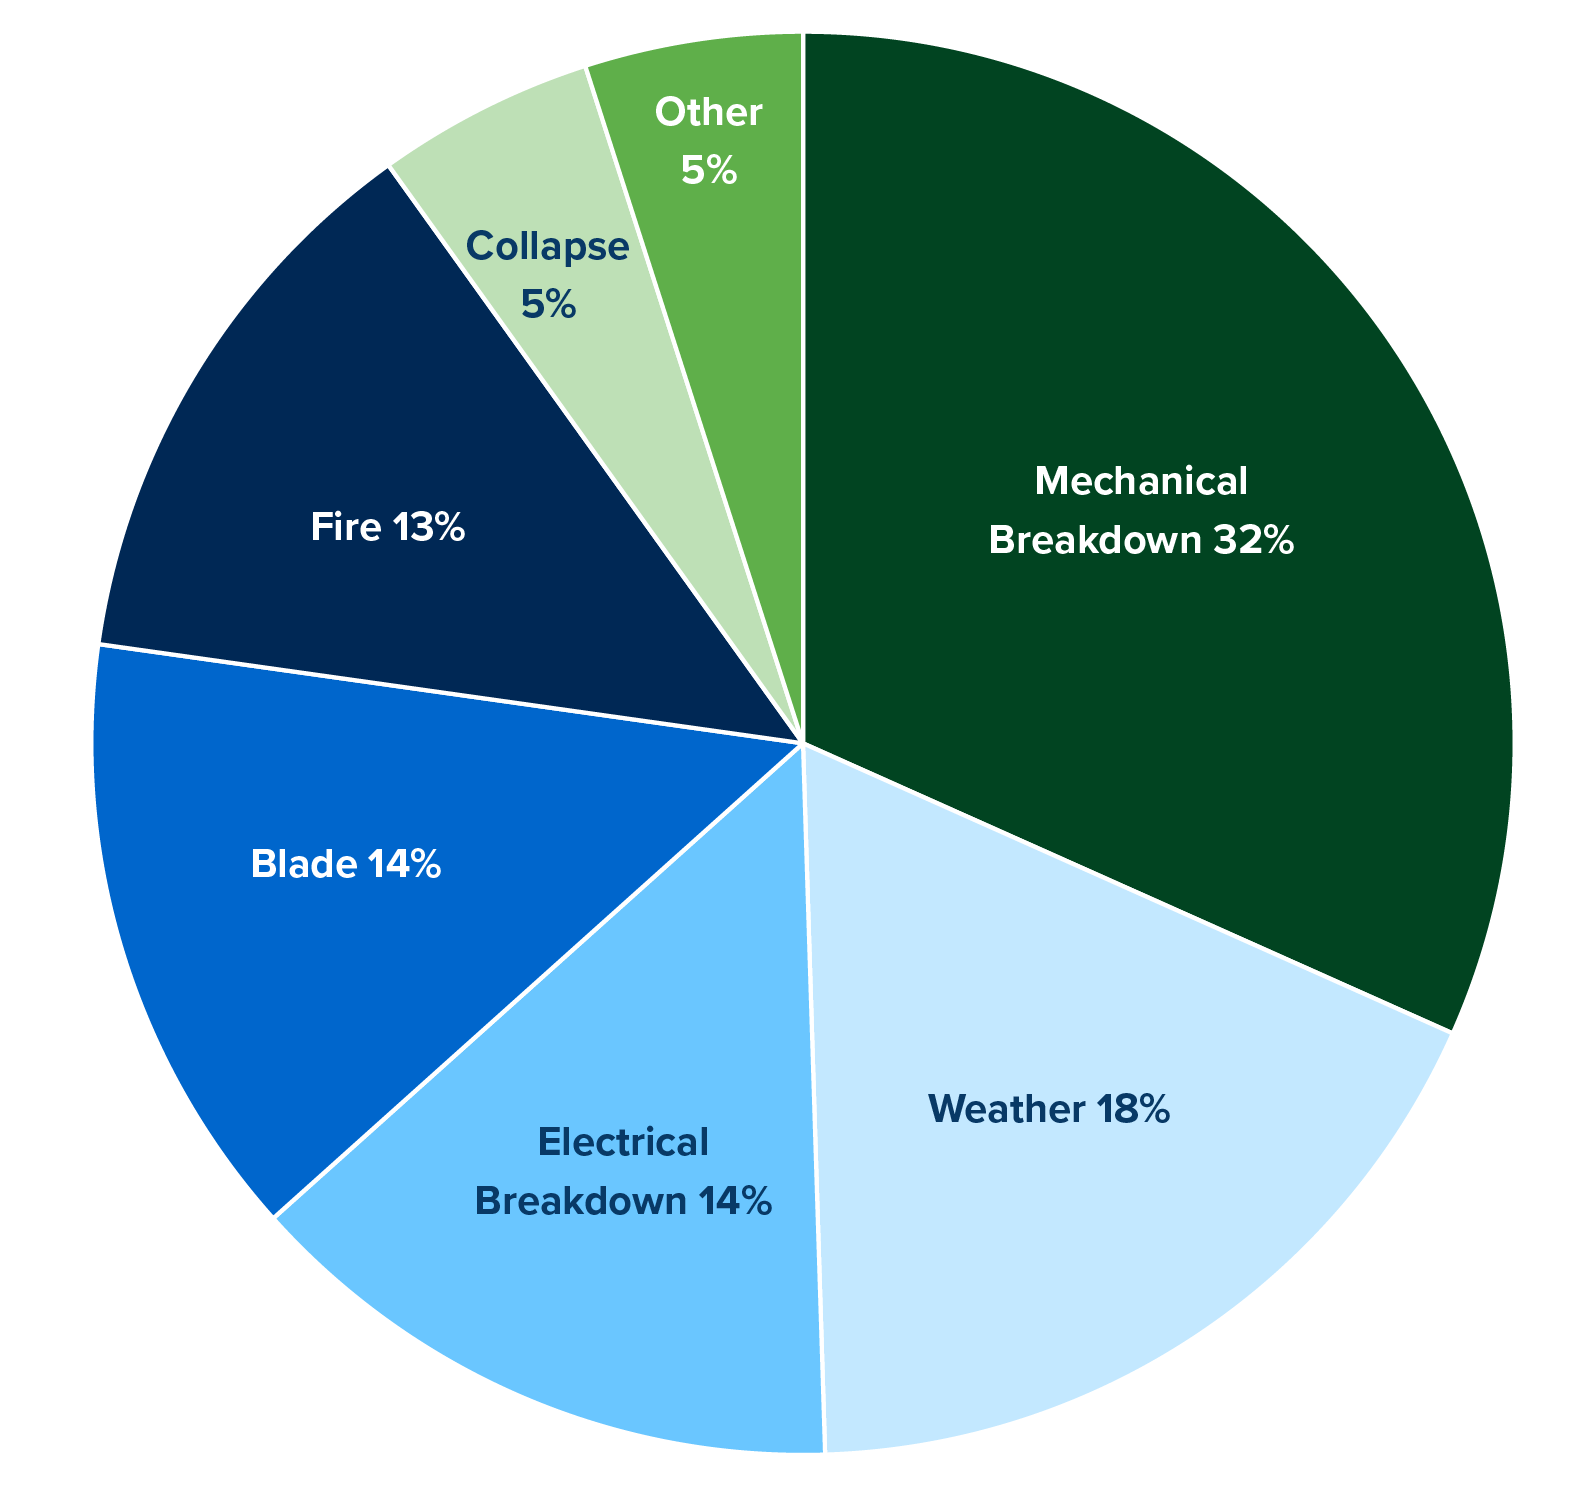
Above shows onshore wind loss by occurrence. The most severe losses are typically wind turbine generator (WTG) collapses or up-tower fire/electrical breakdowns.
Wildfire Impacts on Liability Insurance
January 2025 witnessed historically devastating wildfires in Southern California. Total insured losses from these fires are still being tabulated. The overwhelming majority of damage was to residential structures, with minimal damage to commercial structures. While subject to change, these events had a negligible impact on the energy property insurance marketplace. However, the third-party liability story about these fires is still being written and will likely worsen the wildfire liability insurance marketplace.
Wildfire events along the West Coast in recent years have spurred sporadic wildfire surcharges within general liability premium calculations. The magnitude of liability exposure from consistently large events overstressed the underwriting models for markets supporting power generation assets. The wildfire exposure was evolving, but underwriters could not quantify or justify significant premium increases.
The 2023 wildfires in Maui reshaped wildfire liability exposure for many insurance companies. FEMA estimates the total damage to be $5.52B from this event. While the loss estimates are significant, these wildfires changed the loss estimation approach used by underwriters of liability and property insurance products. Wildfire exposure analysis changed from evaluating ignition sources to the severity of wind exposure on a given parcel of land. Overnight, asset portfolio wildfire liability and property exposures significantly increased. In late 2023, insurance companies were driven to seek specific premium for this newly discovered exposure to their balance sheets.
Insurance companies, brokers and customers have worked to create options reflecting real-time risk appetites. Options vary from full risk retention via operational cash flow, stand-alone captive creation, group captives, pools and multiple-year deals to mitigate cost increases via stair-step strategies. The consistent theme is the increased cost of risk related to this newly discovered wildfire exposure to customer asset portfolios. For many utilities, especially those with large liability towers, it became difficult and costly to piece together replacement coverage in 2024. Only a few options from Bermuda markets, London markets or bespoke parametric cover for competition arose against AEGIS.
While casualty insurers occasionally alter, reduce or eliminate coverage, this is typically communicated ahead of time. In the second half of 2024, AEGIS began polling members to understand their perceived wildfire liability exposures and appetites for transferring that risk to other balance sheets.
In early 2025, AEGIS offered up to $150M in wildfire liability capacity with varying sublimit options but required commitments for multiple years; these options were costly. EIM announced potential increases of the maximum available wildfire sublimit capacity to $65M. The additional capacity will be underwritten on a case-by-case basis and is available at respective renewals. EIM has sought new opportunities to responsibly deploy additional limits while maintaining financial protection from a catastrophic multi-fire scenario. Availability of this additional capacity is subject to underwriting review and approval. It is underwritten according to the guidelines EIM is currently utilizing to provide strong differentiation for the risk profiles of individual members and regions, except California.
The EIM offering does have one issue—the 150% surcharge has been an item of contention for a number of policyholders in the event of a large loss. In essence, EIM will require a policyholder to make a balloon payment to return to at least a 150% historical loss ratio.
Based on member feedback in 2024, EIM has another wildfire liability offering, which may prove useful to those members who can utilize captives.
- $35M Multi-Member Wildfire Cell Concept: EIM has collaborated with industry partners to develop a wildfire risk transfer mechanism through EIS. The cell is structured as a multi-member cell with familiar “mutual concept” protective features that can deliver up to $35M in additional capacity with a value to match those features.
Bess Fire in Moss Landing
The fire at the Moss Landing Energy Storage Facility is a wake-up call for the insurance industry in specific elements tied to energy storage systems. The outcomes from the incident will likely shape future insurance frameworks for large-scale energy storage systems installed inside buildings or occupied spaces.
The insurance market is anticipating losses of at least $500 million, reflecting property damage and business interruption costs. The scope of damage is the complete destruction of roughly 50% of the facility, disrupting energy storage and supply for California’s electrical grid.² Most outdoor, containerized energy storage system loss estimates do not rise above the loss of one, two or four containers based on container spacing. These losses estimate values are minimal compared to the $500M reserved for Moss Landing. Given the scale of the loss, insurers are expected to increase rates for any projects installed indoors, inside of buildings or occupied spaces. Quick declinations from most markets for these projects can be expected.
While building-based energy storage systems will face challenges in 2025, containerized projects will receive wide acceptance and competition from property and liability underwriters. These markets have coalesced around similar spacing requirements, similar approaches for loss estimate derivations and preferred lithium-ion chemistries for stationary systems. Lithium Iron Phosphate is considered the preferred chemistry.
Free market developments and technological advancements are anticipated, such as predictive software products that monitor for thermal runaway preconditions at the cell and module levels. These innovations will continue to push the loss event rate per energy storage cell well beyond levels considered for other technologies, such as solar modules, wind turbine gearboxes, gas turbines and steam turbine blades.
From a liability perspective, a lawsuit has been filed against Vistra Energy and PG&E, alleging negligence in fire prevention. If the companies are found liable, insurers may face significant payouts under Liability policies. If the fire is traced to a manufacturing defect in the lithium-ion batteries, product liability claims could follow, impacting battery manufacturers and their insurers. The California Public Utilities Commission (CPUC) is already proposing new safety guidelines for battery storage facilities. Compliance costs for these regulations could be transferred to insurers in the form of higher claims if future incidents occur.
Regulators may push for mandatory insurance coverage to protect local communities from fire-related damage. Reinsurers who back large scale insurance policies may re-evaluate their exposure to battery storage projects and demand higher premiums from primary insurers. Some reinsurers may limit their energy storage involvement due to increased fire risks.
Innovations in Surety
In the renewable energy sector, financial assurance mechanisms such as surety bonds and standby letters of credit (SBLCs) are pivotal in ensuring project completion and compliance with contractual obligations. Understanding their roles, benefits and current market conditions is essential for stakeholders in this rapidly evolving industry.
Surety bonds serve as a financial guarantee that a project will be completed according to the terms of a contract. They are tripartite agreements involving the project owner (obligee), the contractor (principal) and the surety company. In the event of a contractor default, the surety steps in to fulfill the contractual obligations, thereby mitigating financial risks for the obligee.
The renewable energy sector has seen a significant uptick in the utilization of surety bonds. This trend is driven by the increasing demand for renewable energy projects and the need for financial instruments that can provide assurance to project owners and investors.
Surety bonds offer several advantages:
- Unlike SBLCs, surety bonds do not tie up a contractor’s credit lines, preserving liquidity for other operational needs.
- They protect project owners from potential losses due to contractor default, ensuring project continuity.
- The backing of a reputable surety company can enhance the credibility of contractors, making it easier to secure projects and financing.
Market conditions in 2024 have been favorable for the adoption of surety bonds in renewable energy. The surety market experienced robust growth, expanding by 6.8% to reach a size of $19.62 billion. Projections indicate that this upward trajectory will continue, with the global surety market expected to grow to approximately $27 billion by 2030.3
SBLCs are financial instruments issued by banks that guarantee payment to a beneficiary if the applicant fails to fulfill contractual obligations. In renewable energy projects, SBLCs are often used to assure project owners or financiers of the contractor’s commitment and financial stability.
While SBLCs provide a strong guarantee, they have certain limitations:
- Issuing an SBLC typically reduces the contractor’s available credit, potentially limiting their capacity to engage in multiple projects simultaneously.
- The fees associated with SBLCs can be higher compared to surety bonds, impacting the overall project budget.
The choice between surety bonds and SBLCs depends on various factors, including the project’s financial structure, the contractor’s credit capacity and specific contractual requirements. However, surety bonds often offer distinct advantages in the renewable energy sector:
- Preservation of credit lines: Surety bonds do not encumber contractor banking facilities, allowing for greater financial flexibility.
- Specialized underwriting: Surety companies often have expertise in assessing construction and energy projects, enabling more tailored risk assessment and support.
Given these considerations, stakeholders in renewable energy projects are increasingly favoring surety bonds over SBLCs to meet their financial assurance needs.
Tax Credit Insurance
The tax credit insurance market has seen significant growth as investors and tax credit buyers increasingly seek coverage to mitigate potential risks associated with these transactions. One of the most notable developments is carriers continuing to state the standard “change in law” exclusion of a tax insurance policy does not apply to a “retroactive change in law.” This has provided stakeholders with additional security against legislative shifts that could impact the validity of purchased tax credits.
Pricing for tax credit insurance generally falls within the 2-4% range of the insured limit, reflecting both the perceived risk and the growing demand for coverage. This trend is driven by heightened scrutiny around tax credit investments, particularly in renewable energy and other incentivized sectors, where buyers want assurance that their credits will be honored by the IRS. Greater underwriting scrutiny can be expected when Basis Step-ups exceed 20%. Larger percentages are encountering higher rates and much larger and more complex retentions.
Buyers of tax credits frequently require tax insurance as a condition of the transactions, with coverage limits often exceeding the face value of the credits themselves. Many seek limits between 1.2 to 1.5 times the size of the purchased credits to account for potential adjustments, penalties or interest that could arise in the event of a dispute. This demand has led to an increasingly competitive insurance market, with insurers refining their underwriting processes to accommodate larger transactions while ensuring adequate protection. As regulatory and legislative landscapes continue to evolve, tax credit insurance is expected to remain a critical tool in facilitating tax credit investments and fostering confidence among buyers and investors.
1. NOAA National Centers for Environmental Information (NCEI) U.S. Billion-Dollar Weather and Climate Disasters (2025)
2. Insurance Insider January(2025).
3. Key Trends Facing the Surety Market in 2025
